Introduction
poispalette is an R package that facilitates the use of Poisson Consulting colour palettes in data plots and maps.
Installation
To install the latest development version from GitHub
# install.packages("remotes")
remotes::install_github("poissonconsulting/poispalette")
Demonstration
Retrieve Poisson colours and palettes
library(poispalette)

pois_pal("discrete")
#>      black       blue        red     yellow     purple      green light blue
#>  "#000000"  "#3063A3"  "#E8613C"  "#F7B500"  "#821C65"  "#63BB42"  "#90BDE5"
#>     orchid       grey
#>  "#D888CF"  "#7D7D7D"

pois_cols(c("red", "yellow"))
#>       red    yellow
#> "#E8613C" "#F7B500"
Plot discrete scales
library(ggplot2)

ggplot2::ggplot(poispalette::points, aes(x = RandomX, y = RandomY)) +
  geom_point(aes(colour = ID), size = 2) +
  scale_colour_disc_poisson()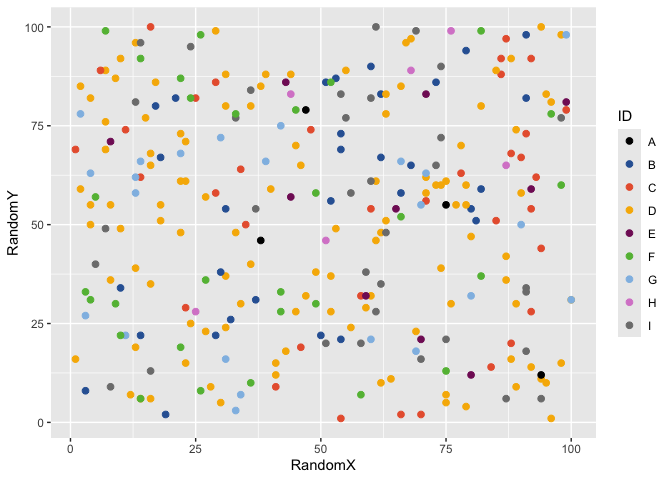
Plot gradient scales
ggplot2::ggplot(poispalette::points, aes(x = X, y = Y)) +
  geom_point(aes(colour = RandomX), size = 2) +
  scale_colour_grad_poisson(palette = "cool")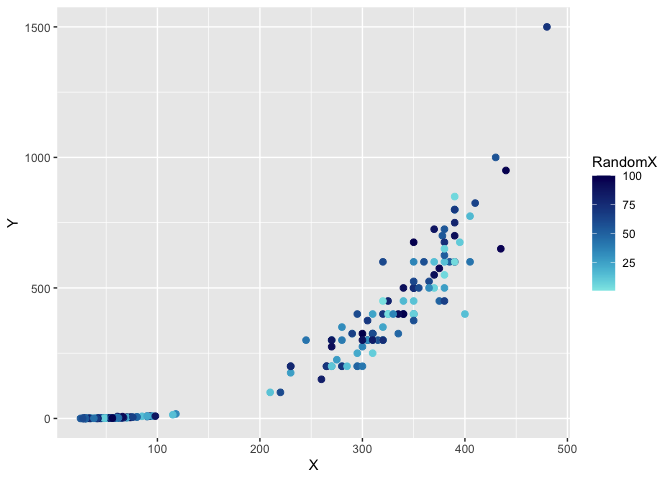
Code of Conduct
Please note that the poispalette project is released with a Contributor Code of Conduct. By contributing to this project, you agree to abide by its terms.