Introduction
The goal of bbouretro is to provide the ability to calculate survival, recruitment and population growth using the traditional methods.
Installation
To install the latest version from GitHub
# install.packages("remotes")
remotes::install_github("poissonconsulting/bbouretro")
Example
set.seed(101)

library(bbouretro)
library(bboudata)
#>
#> Attaching package: 'bboudata'
#> The following object is masked from 'package:bbouretro':
#>
#>     licensing_md

# generate recruitment estimate for each year
recruitment_est <-
  bbr_recruitment(
    bboudata::bbourecruit_c,
    adult_female_proportion = 0.65,
    sex_ratio = 0.5,
    variance = "bootstrap"
  )
bbr_plot_recruitment(recruitment_est)
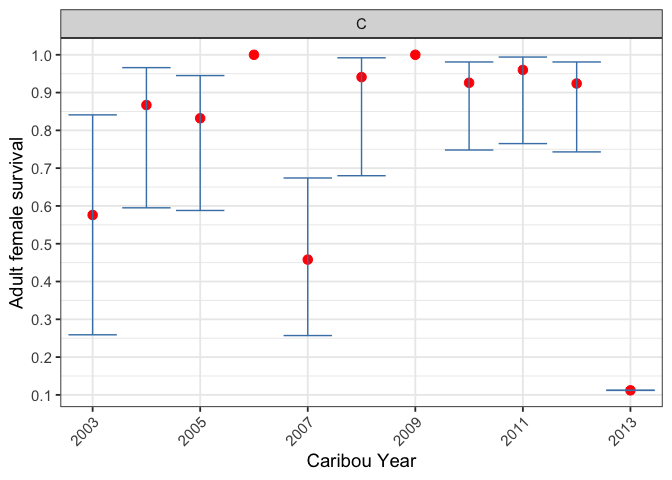
# generate survival estimate for each year
survival_est <-
  bbr_survival(
    bboudata::bbousurv_c,
    include_uncertain_morts = TRUE,
    variance = "greenwood"
  )
bbr_plot_survival(survival_est)
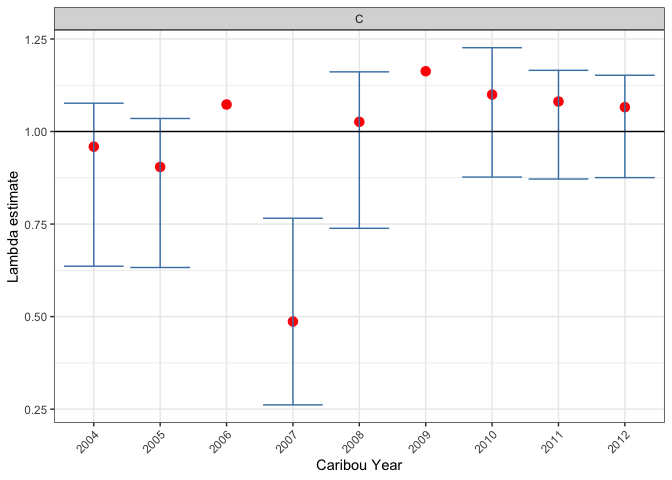
# calculate lambda now that both recruitment and survival have been calculated
growth_est <- bbr_growth(survival_est, recruitment_est)
summary <- bbr_growth_summarize(growth_est)
summary
#> # A tibble: 9 × 13
#>   PopulationName CaribouYear     S     R estimate     se  lower  upper prop_lgt1
#>   <chr>                <int> <dbl> <dbl>    <dbl>  <dbl>  <dbl>  <dbl>     <dbl>
#> 1 C                     2004 0.867 0.096    0.959  0.115  0.636  1.08      0.323
#> 2 C                     2005 0.832 0.08     0.904  0.105  0.633  1.03      0.093
#> 3 C                     2006 1     0.068    1.07  NA     NA     NA        NA
#> 4 C                     2007 0.458 0.059    0.487  0.128  0.262  0.766     0
#> 5 C                     2008 0.941 0.083    1.03   0.1    0.739  1.16      0.615
#> 6 C                     2009 1     0.14     1.16  NA     NA     NA        NA
#> 7 C                     2010 0.926 0.158    1.1    0.085  0.877  1.23      0.854
#> 8 C                     2011 0.96  0.112    1.08   0.075  0.872  1.16      0.861
#> 9 C                     2012 0.924 0.133    1.07   0.072  0.875  1.15      0.808
#> # ℹ 4 more variables: mean_sim_survival <dbl>, mean_sim_recruitment <dbl>,
#> #   mean_sim_growth <dbl>, median_sim_growth <dbl>
bbr_plot_growth(growth_est)
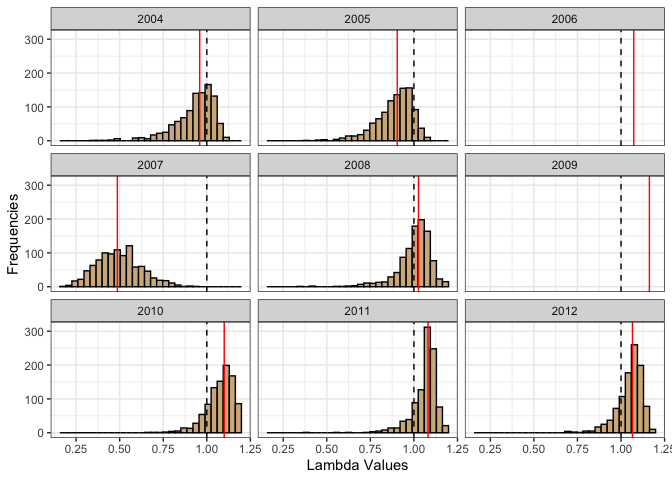
bbr_plot_growth_distributions(growth_est)
Code of Conduct
Please note that this project is released with a Contributor Code of Conduct. By contributing to this project, you agree to abide by its terms.
Licensing
Copyright 2024 Province of Alberta
The documentation is released under the CC BY 4.0 License
The code is released under the Apache License 2.0