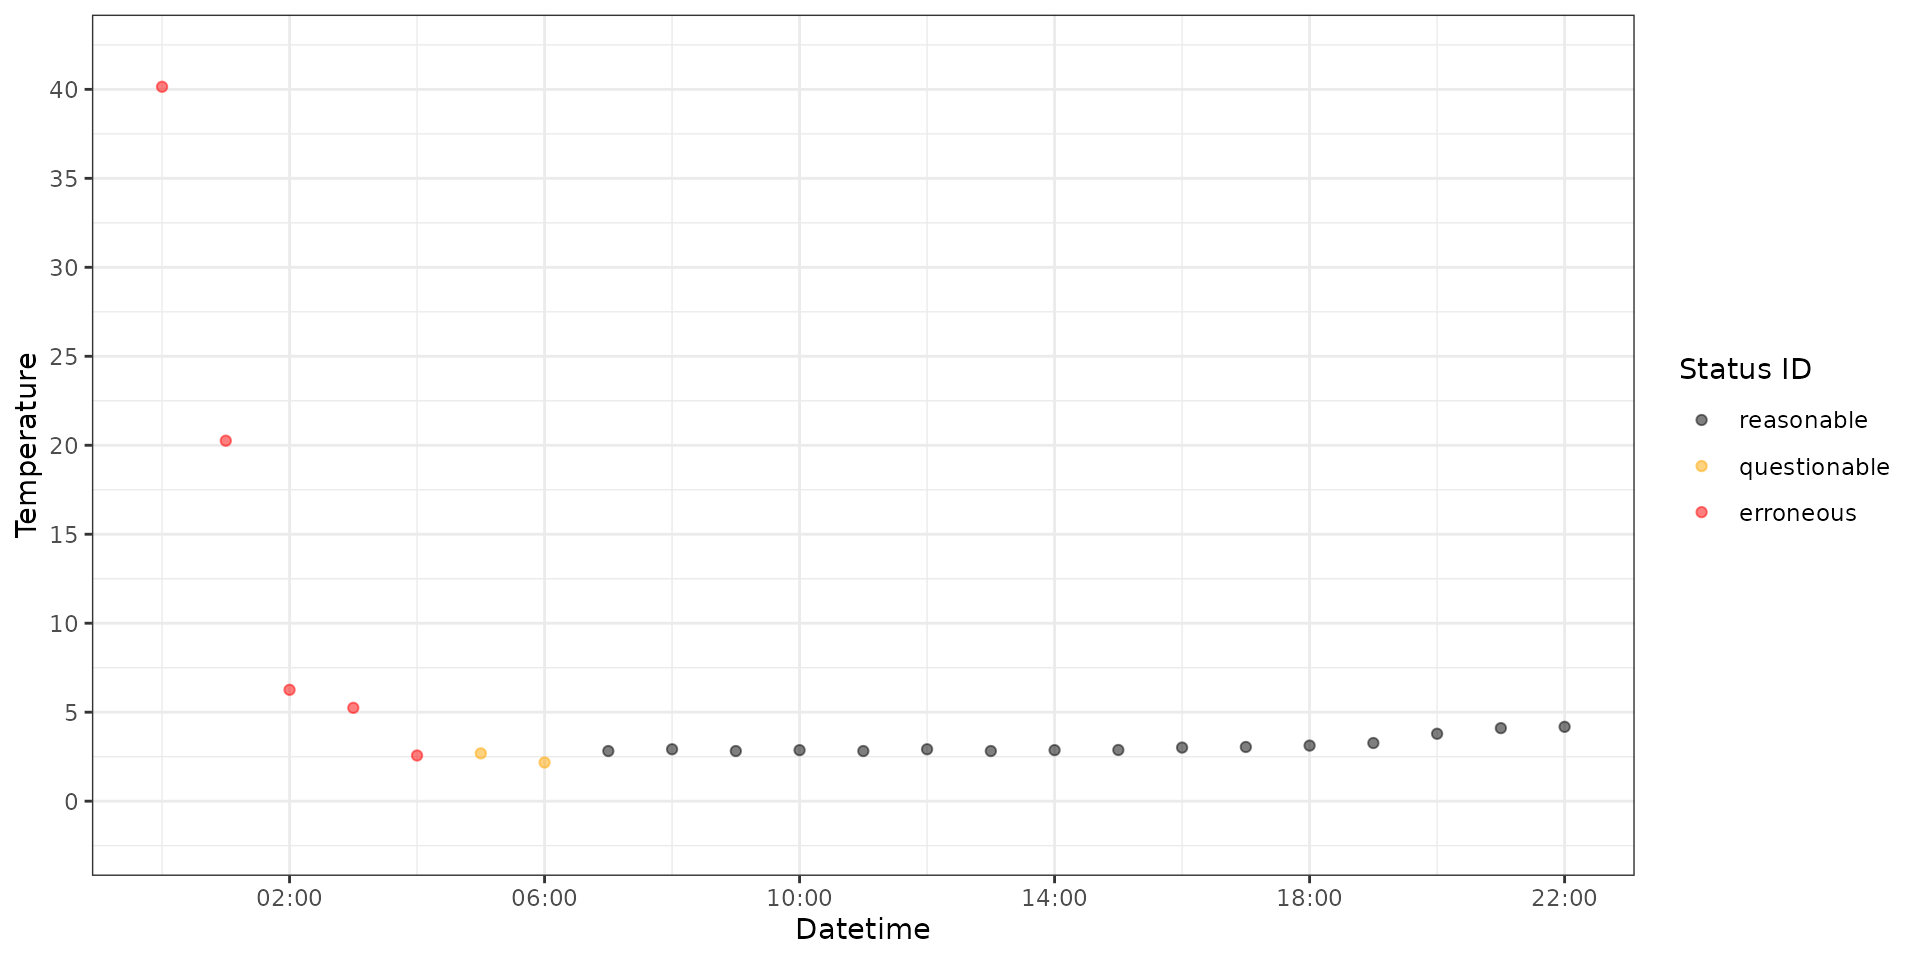
Raw logger temperature time series data can be run through
classify_water_temp_data() to classify each value as
reasonable, questionable, or erroneous. Only a single deployment can be
classified at a time. Users are responsible for ensuring that the data
are in the correct format before running this function.
The values are classified following these rules:
- If the temperature is greater then or equal to or less then or equal
to the min and max parameters (
questionable_min,questionable_max,erroneous_min,erroneous_max). - If the rate of change (degrees per hour) between the adjacent lag
value is greater then or equal to the rate parameters
(
questionable_rate,erroneous_rate). - A value adjacent to a questionable/erroneous value are coded as questionable/erroneous.
- A time buffer (hours) is added to the questionable/erroneous values
such that adjacent values within or equal to the buffer
(
questionable_buffer,erroneous_buffer) are coded as questionable/erroneous. - Reasonable values identified between questionable or erroneous
values are coded as questionable if the gap between the nearest
questionable or erroneous value is less then or equal to the
gap_rangeparameter. 6 If a temperature value is missing the function will ignore the value and not classify it.
Usage
data <- tibble::tribble(
  ~temperature_date_time, ~water_temperature,
  "2021-05-07 00:00:00",  40.145,
  "2021-05-07 01:00:00",  20.257,
  "2021-05-07 02:00:00",  6.257,
  "2021-05-07 03:00:00",  5.245,
  "2021-05-07 04:00:00",  2.567,
  "2021-05-07 05:00:00",  2.687,
  "2021-05-07 06:00:00",  2.175,
  "2021-05-07 07:00:00",  2.817,
  "2021-05-07 08:00:00",  2.917,
  "2021-05-07 09:00:00",  2.817,
  "2021-05-07 10:00:00",  2.867,
  "2021-05-07 11:00:00",  2.817,
  "2021-05-07 12:00:00",  2.917,
  "2021-05-07 13:00:00",  2.817,
  "2021-05-07 14:00:00",  2.867,
  "2021-05-07 15:00:00",  2.877,
  "2021-05-07 16:00:00",  3.012,
  "2021-05-07 17:00:00",  3.045,
  "2021-05-07 18:00:00",  3.124,
  "2021-05-07 19:00:00",  3.268,
  "2021-05-07 20:00:00",  3.789,
  "2021-05-07 21:00:00",  4.104,
  "2021-05-07 22:00:00",  4.178
) |>
  dplyr::mutate(
    temperature_date_time = as.POSIXct(temperature_date_time, tz = "UTC")
  )

classified_data <- classify_water_temp_data(data)

classified_data
#> # A tibble: 23 × 3
#>    temperature_date_time water_temperature status_id
#>    <dttm>                            <dbl> <ord>
#>  1 2021-05-07 00:00:00               40.1  erroneous
#>  2 2021-05-07 01:00:00               20.3  erroneous
#>  3 2021-05-07 02:00:00                6.26 erroneous
#>  4 2021-05-07 03:00:00                5.24 erroneous
#>  5 2021-05-07 04:00:00                2.57 erroneous
#>  6 2021-05-07 05:00:00                2.69 questionable
#>  7 2021-05-07 06:00:00                2.17 questionable
#>  8 2021-05-07 07:00:00                2.82 reasonable
#>  9 2021-05-07 08:00:00                2.92 reasonable
#> 10 2021-05-07 09:00:00                2.82 reasonable
#> # ℹ 13 more rows
ggplot(classified_data) +
  geom_point(
    aes(
      x = temperature_date_time,
      y = water_temperature,
      color = status_id
    ),
    alpha = 0.5
  ) +
  labs(
    y = "Temperature",
    x = "Datetime"
  ) +
  theme_bw() +
  scale_x_datetime(
    breaks = date_breaks("4 hour"),
    labels = date_format("%H:%M")
  ) +
  scale_y_continuous(
    breaks = seq(-5, 45, 5),
    limits = c(-2, 42)
  ) +
  scale_color_manual(
    "Status ID",
    values = c(
      "reasonable" = "black",
      "questionable" = "orange",
      "erroneous" = "red"
    )
  )
Changing temperature min and max parameters
classify_water_temp_data(
  data,
  questionable_max = 1,
  erroneous_max = 20
)
Changing rate of change parameters
classify_water_temp_data(
  data,
  questionable_rate = 1,
  erroneous_rate = 10
)
Removing the time buffer
classify_water_temp_data(
  data,
  questionable_buffer = 0,
  erroneous_buffer = 0
)
Removing the gap filling
classify_water_temp_data(
  data,
  gap_range = 0
)
Process
- Read in a logger file
- Create date time column and name it
temperature_date_time - Ensure the temperature column is named
water_temperature - Confirm data is from a single deployment
- Run data through
classify_water_temp_data()function - Save data to a csv file
# install.packages("tidyverse")
# install.packages("devtools")
# devtools::install_github("poissonconsulting/teckfish")

library(teckfish)
library(tidyverse)

# read in logger file
data <- readr::read_csv("path/to/file.csv")

# create date time column
data <- data |>
  dplyr::mutate(
    temperature_date_time = as.POSIXct(temperature_date_time, tz = "UTC")
  )

# ensure temperature column is named water_temperature
data <- data |>
  dplyr::rename(
    water_temperature = temperature
  )

# confirm data is from a single deployment
data <-
  data |>
  dplyr::filter(
    deployment_id == "12345"
  )

# run data through classify_water_temp_data() function
classified_data <- classify_water_temp_data(data)

# save data to a csv file
readr::write_csv(classified_data, "path/to/file.csv")