Getting Started with bisonpicsuite
Source:vignettes/bisonpicsuite-getting-started.Rmd
bisonpicsuite-getting-started.RmdThe goal of the bisonpic suite of tools (all loaded by
bisonpicsuite) is to facilitate the visualization and
analysis of camera trap data for wood bison herds.
In order to use the bisonpic suite of packages
(bisonpicsuite) you need to install R (see below).
Installation
In order to install R (R Core Team 2023) the appropriate binary for the user’s operating system should be downloaded from CRAN and then installed. RStudio is a helpful user interface for R, and can be downloaded here.
To install the latest development version of
bisonpicsuite, execute the following code in the RStudio
console. This will install the full suite of bisonpic software (see
below).
install.packages("remotes")
remotes::install_github("poissonconsulting/bisonpicsuite")
Load the bisonpic suite of packages by executing the following code
library(bisonpicsuite)
#> Registered S3 method overwritten by 'mcmcr':
#>   method         from
#>   as.mcmc.nlists nlist
#> Attaching: bisonpictools shinybisonpic runbisonpic bisonpicsuite
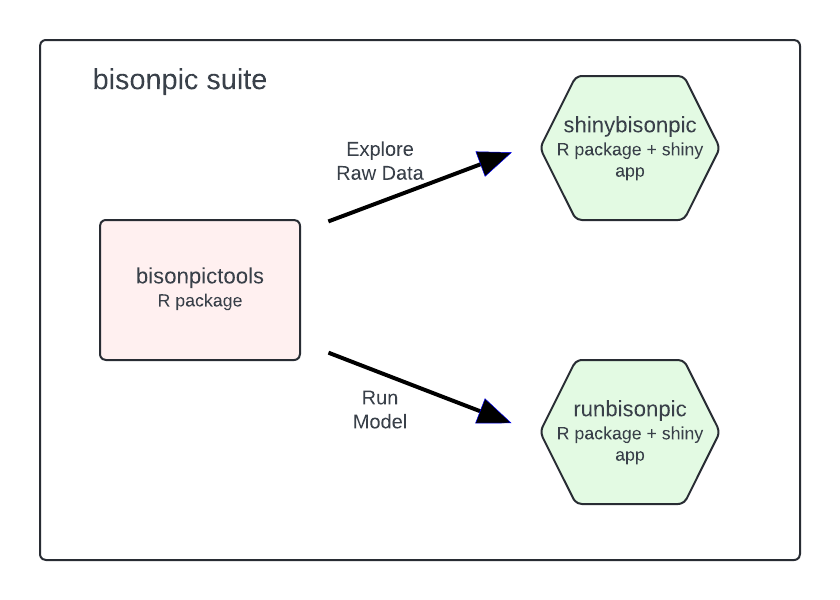
bisonpic suite
The bisonpic suite includes the following packages:
bisonpictools provides the underlying visualization and
analysis functionality; shinybisonpic is a web-based Shiny
app that provides a Graphical User Interface to facilitate data
visualization and exploration, and runbisonpic is a
local-based Shiny app to set up and run an analysis.

Data
In both the shinybisonpic and runbisonpic
Shiny apps, the user can download a templated excel spreadsheet to
populate the following data tables:
-
event_datacontains the camera trap event data, including the date and time of each event, location of the camera trap, and the number of individuals in each class -
location_datacontains the coordinates of the camera traps -
census_datacontains census estimates of the population from aerial surveys, and the date of the surveys -
proportion_calf_datacontains estimates of the proportion of calves in the population from aerial surveys, and the date of the surveys
The template contains information about what is required in each column. When uploaded, the data is checked to ensure correct formatting. We suggest downloading the template from one of the Shiny apps and populating it, to ensure the tables have the correct sheet and column names, even if the user wishes to use the RStudio console to run the data visualization and/or analysis steps.
Data Visualization
shinybisonpic
Use the shinybisonpic
Shiny app to explore the locations of camera traps and the the
ratios of different classes of wood bison in camera trap observations.
Refer to the user
guide for more information on how to use the
shinybisonpic app.
Data Analysis
runbisonpic
Launch the local data analysis app by running the following lines of code in the RStudio console.
# Launch local app
runbisonpic::launch_runbisonpic()
See the user
guide for more guidance on how to use the runbisonpic
app.
Using the RStudio Console
Data visualization and analysis can alternatively be done in the
RStudio console by running the functions from bisonpictools
that form the basis of both of the above shiny apps. See the “Getting
Started with bisonpictools” article for more detail.
Contribution
Please report any issues.
Code of Conduct
Please note that the bisonpicsuite project is released
with a Contributor
Code of Conduct. By contributing to this project, you agree to abide
by its terms.
References
Licensing
Copyright 2023 Province of Alberta
Licensed under the Apache License, Version 2.0 (the “License”); you may not use this file except in compliance with the License. You may obtain a copy of the License at
http://www.apache.org/licenses/LICENSE-2.0
Unless required by applicable law or agreed to in writing, software distributed under the License is distributed on an “AS IS” BASIS, WITHOUT WARRANTIES OR CONDITIONS OF ANY KIND, either express or implied. See the License for the specific language governing permissions and limitations under the License.