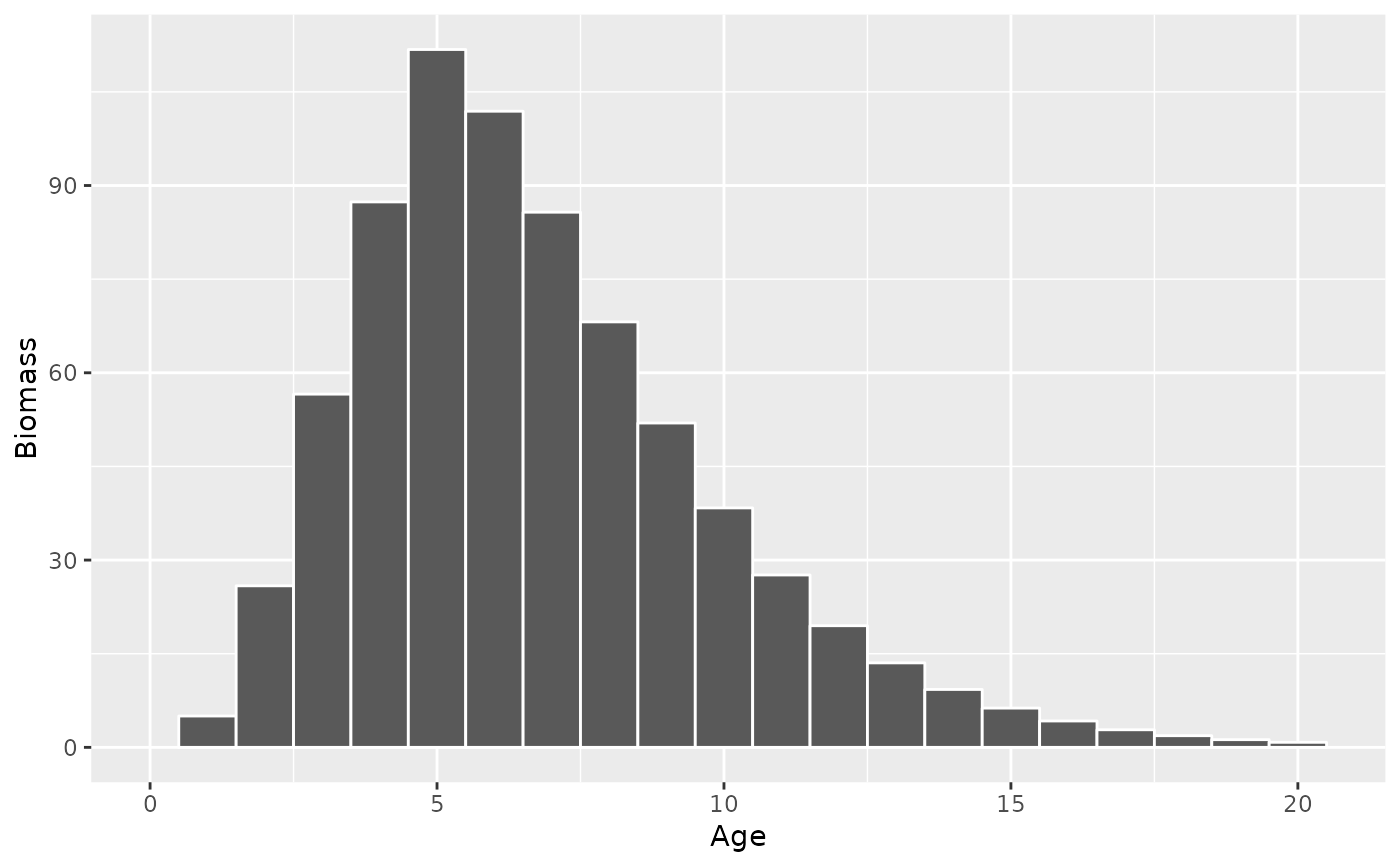
Produces a frequency histogram of the total fish 'Biomass' or 'Eggs' deposition by 'Age' class.
Arguments
- population
An object of class
ypr_population().- y
A string of the term on the y-axis.
- color
A string of the color around each bar (or NULL).
See also
Other biomass:
ypr_tabulate_biomass()
Other plot:
ypr_plot_fish(),
ypr_plot_schedule(),
ypr_plot_sr(),
ypr_plot_yield()
Examples
ypr_plot_biomass(ypr_population(), color = "white")