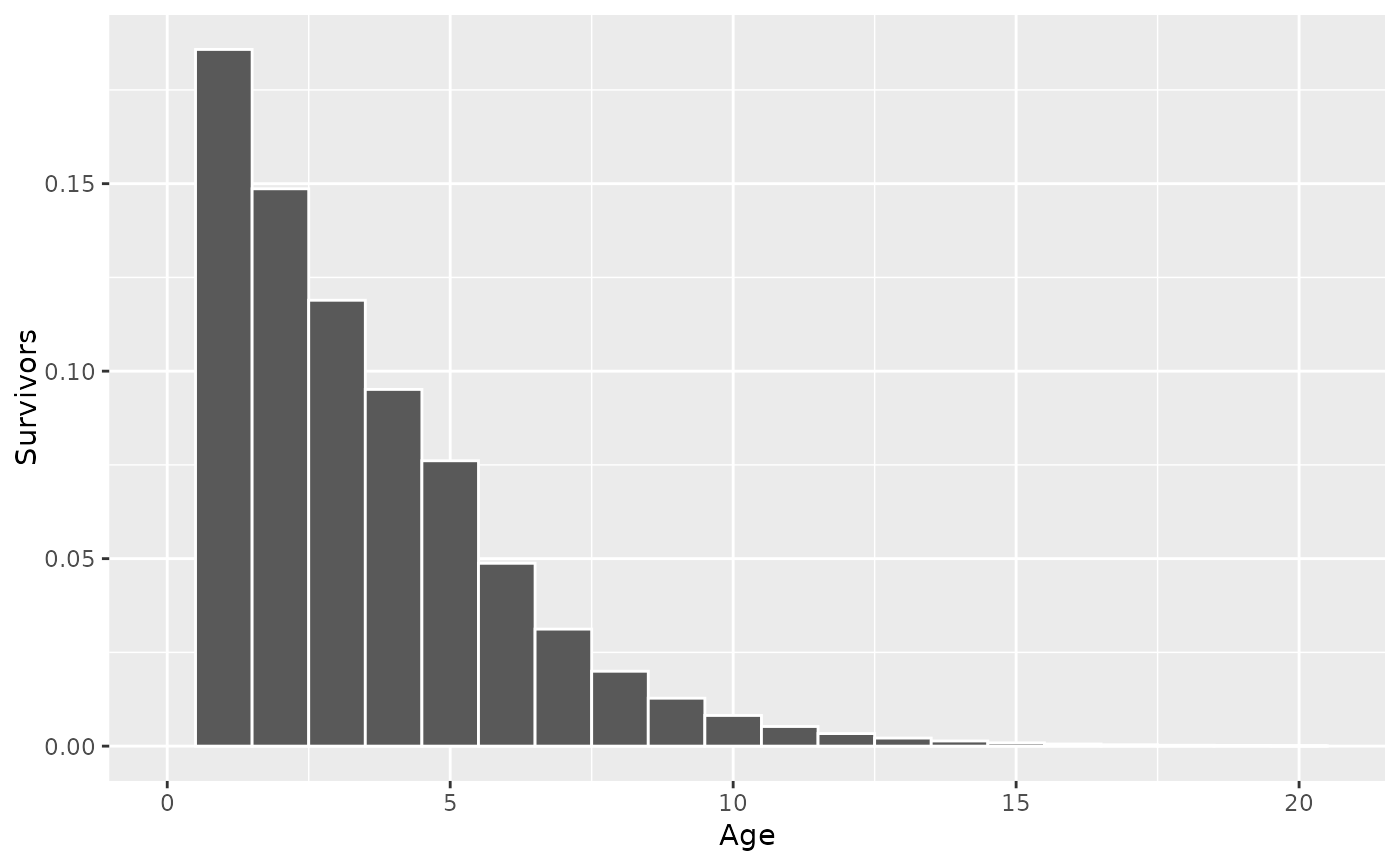
Produces a frequency histogram of the number of fish in the 'Survivors', 'Spawners', 'Caught', 'Harvested' or 'Released' categories by 'Length', 'Age' or 'Weight' class.
Usage
ypr_plot_fish(
  population,
  x = "Age",
  y = "Survivors",
  percent = FALSE,
  binwidth = 1L,
  color = NULL
)
Arguments
- population
An object of class
ypr_population().- x
The object to coerce.
- y
A string of the term on the y-axis.
- percent
A flag specifying whether to plot the number of fish as a percent or frequency (the default).
- binwidth
A positive integer of the width of the bins for grouping.
- color
A string of the color around each bar (or NULL).
See also
Other fish:
ypr_tabulate_fish()
Other plot:
ypr_plot_biomass(),
ypr_plot_schedule(),
ypr_plot_sr(),
ypr_plot_yield()
Examples
ypr_plot_fish(ypr_population(), color = "white")