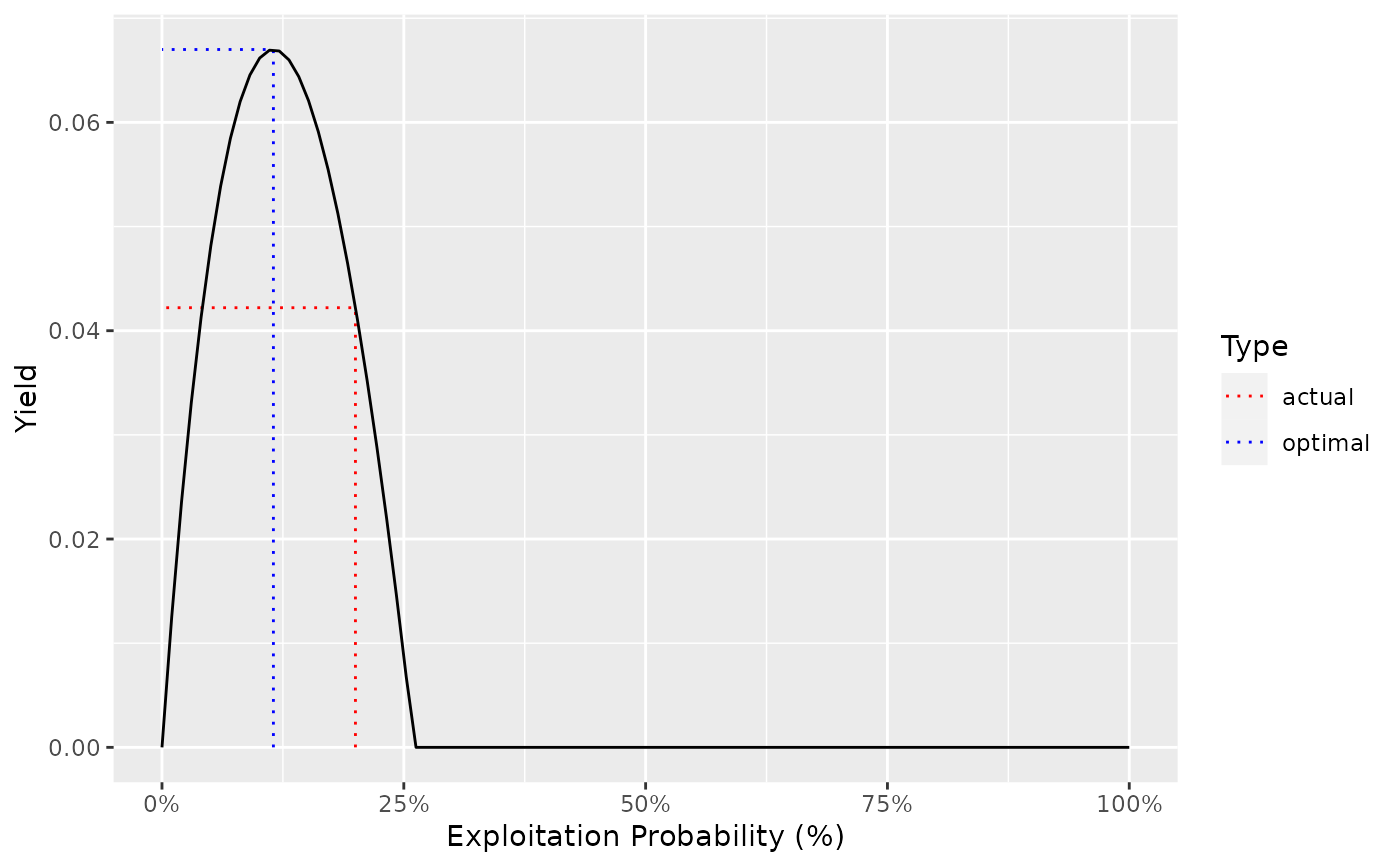
Plots the 'Yield', 'Age', 'Length', 'Weight', 'Effort', or 'YPUE' by the annual interval capture/exploitation probability.
Usage
ypr_plot_yield(object, ...)

# Default S3 method
ypr_plot_yield(
  object,
  y = "Yield",
  pi = seq(0, 1, length.out = 100),
  Ly = 0,
  harvest = TRUE,
  biomass = FALSE,
  u = harvest,
  plot_values = TRUE,
  ...
)

# S3 method for class 'ypr_populations'
ypr_plot_yield(
  object,
  y = "Yield",
  pi = seq(0, 1, length.out = 100),
  Ly = 0,
  harvest = TRUE,
  biomass = FALSE,
  u = harvest,
  plot_values = TRUE,
  ...
)
Arguments
- object
The population or populations.
- ...
These dots are for future extensions and must be empty.
- y
A string of the term on the y-axis.
- pi
A vector of probabilities of capture to calculate the yield for.
- Ly
The minimum length (trophy) fish to consider when calculating the yield (cm).
- harvest
A flag specifying whether to calculate the yield for harvested fish or captures.
- biomass
A flag specifying whether to calculate the yield in terms of the biomass versus number of individuals.
- u
A flag specifying whether to plot the exploitation rate as opposed to the capture rate.
- plot_values
A flag specifying whether to plot the actual and optimal values.
Methods (by class)
ypr_plot_yield(default): Plot Yield by Captureypr_plot_yield(ypr_populations): Plot Yield by Capture
See also
Other populations:
as_ypr_populations(),
chilliwack_bt_05,
ypr_populations(),
ypr_populations_expand(),
ypr_tabulate_sr(),
ypr_tabulate_yield(),
ypr_tabulate_yields()
Other yield:
ypr_tabulate_yield(),
ypr_yield(),
ypr_yields()
Other plot:
ypr_plot_biomass(),
ypr_plot_fish(),
ypr_plot_schedule(),
ypr_plot_sr()
Examples
if (FALSE) { # \dontrun{
ypr_plot_yield(
  ypr_populations(
    Rk = c(2.5, 4.6),
    Llo = c(0, 60)
  ),
  plot_values = FALSE
) +
  ggplot2::facet_wrap(~Llo) +
  ggplot2::aes(group = Rk, color = Rk) +
  ggplot2::scale_color_manual(values = c("black", "blue"))

ypr_plot_yield(ypr_populations(Rk = c(2.5, 4.6), Llo = c(0, 60))) +
  ggplot2::facet_grid(Rk ~ Llo)
} # }

ypr_plot_yield(ypr_population())