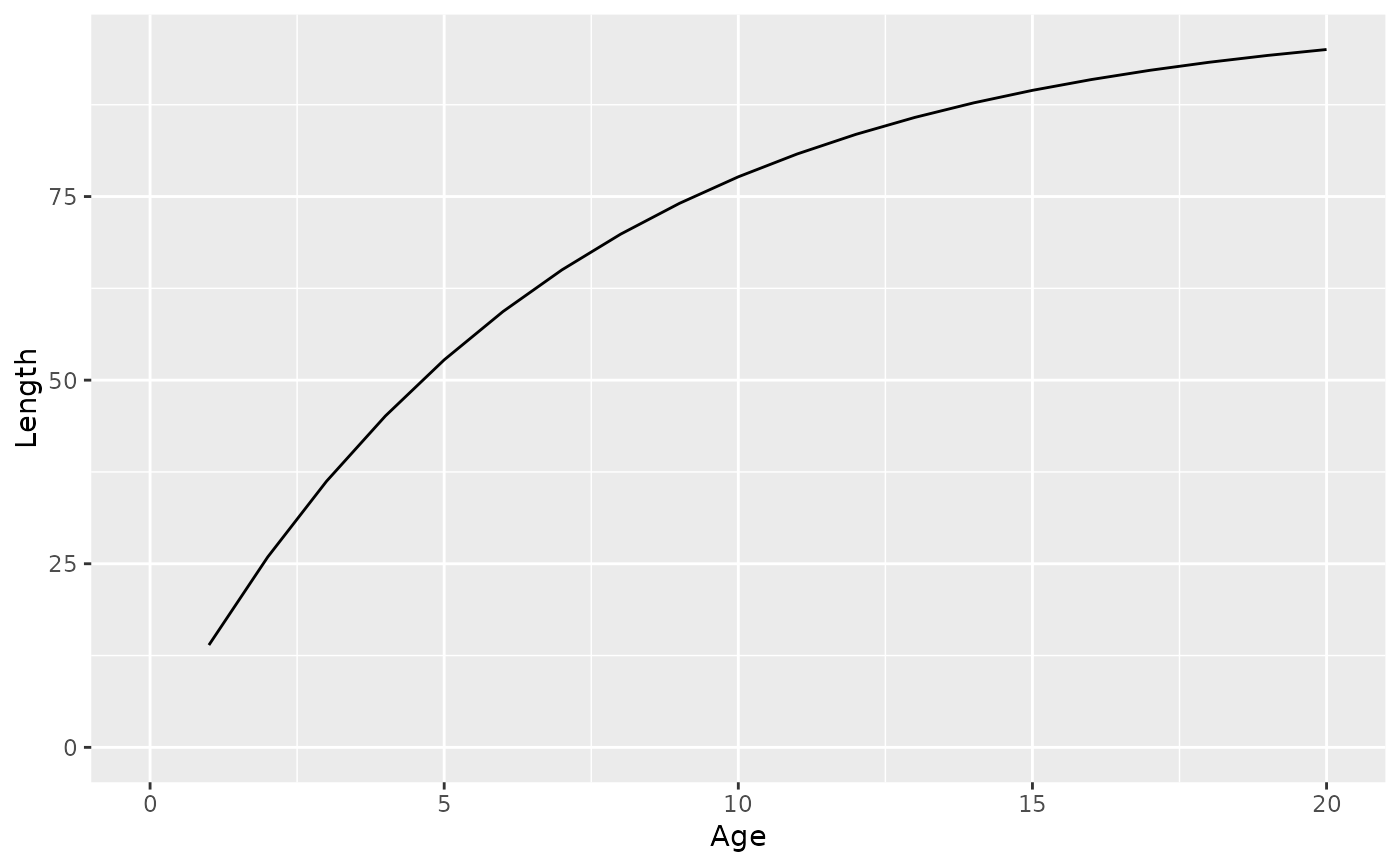
Produces a bivariate line plot of two schedule terms.
Arguments
- population
An object of class
ypr_population().- x
A string of the term on the x-axis.
- y
A string of the term on the y-axis.
See also
Other schedule:
ypr_tabulate_schedule()
Other plot:
ypr_plot_biomass(),
ypr_plot_fish(),
ypr_plot_sr(),
ypr_plot_yield()
Examples
ypr_plot_schedule(ypr_population())